Reading Your Catalog Analytics: What the Numbers Actually Tell You
Views are the least interesting number in your catalog report. Here are the six questions catalog analytics can actually answer, what to change based on each, and what the numbers cannot tell you.
Questo articolo non è ancora stato tradotto in italiano: stai leggendo la versione in inglese. Leggi in inglese
The first time you open the analytics for a published catalog, the eye goes straight to the biggest number: views. It is the least useful number on the page.
Views tell you that something happened. The rest of the report tells you what happened, and that is where the decisions are. This guide goes through the six questions catalog analytics can answer, what you might change based on each, and the questions no catalog report can answer.
One rule before we start: wait for enough readers. With 30 reading sessions, a single reader moves every percentage noticeably. Most reports cover the last 30 days, so give a new catalog a couple of weeks before drawing conclusions.
1. Is anyone opening it?
Look at views together with unique visitors and reading sessions, and compare them with the previous period. The busiest day is often the most telling figure: if it matches the day your newsletter went out, you know which channel actually moved people.
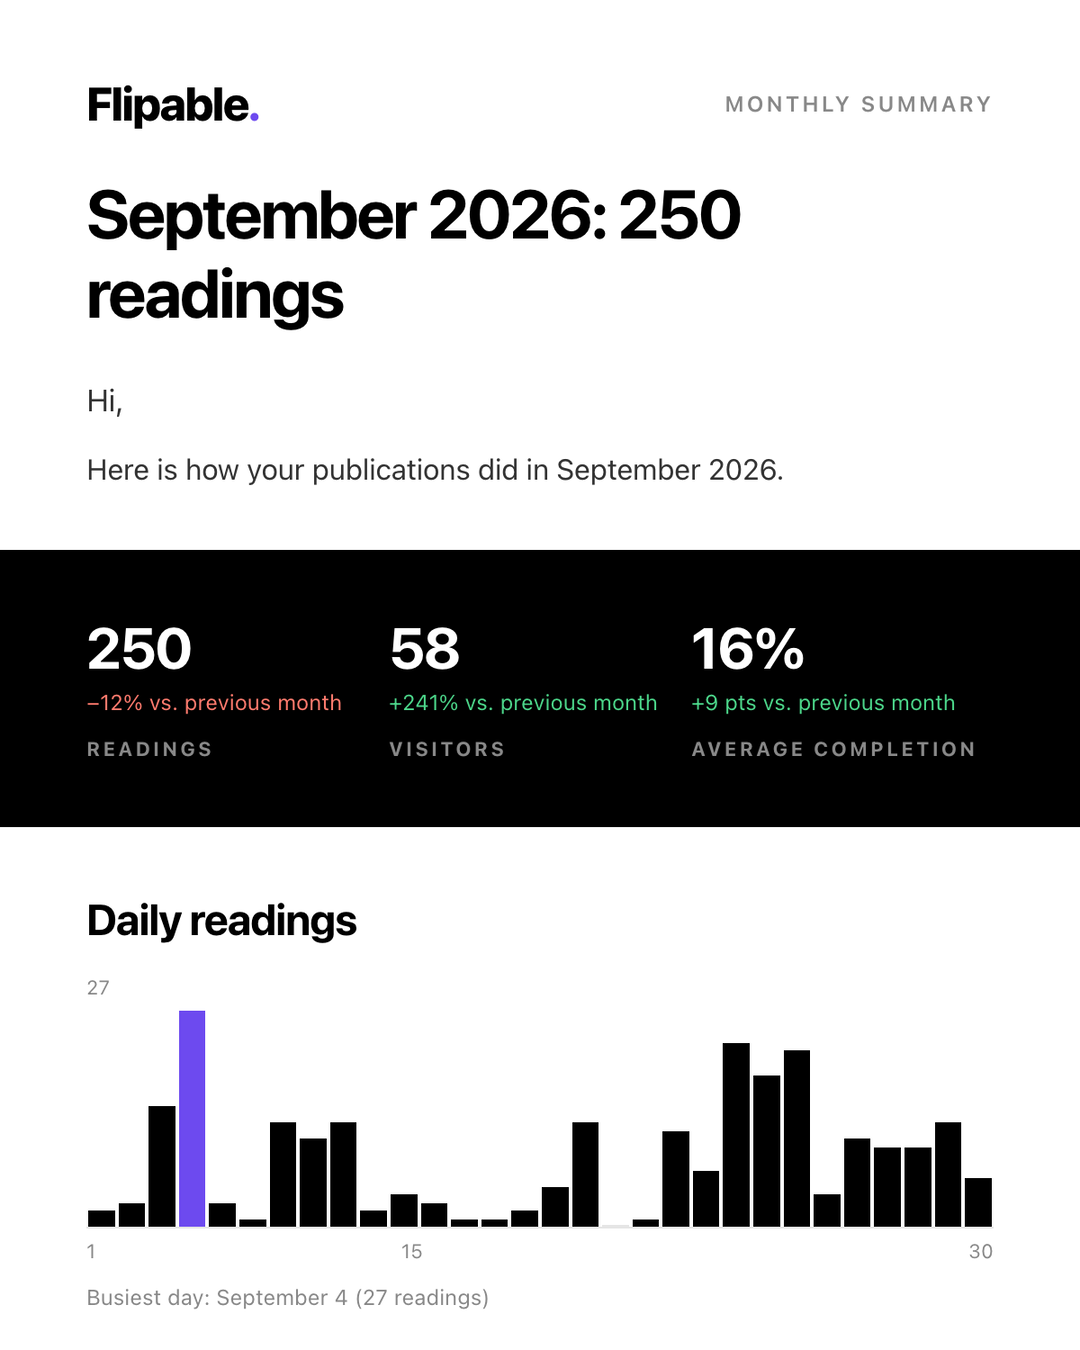
Flipable's monthly summary email shows the previous month's figures, with the busiest day highlighted in the daily chart.
A caveat worth knowing: a "unique visitor" is a browser, not a person. Someone who reads on their phone and later on their laptop counts twice; someone reading in a private window counts again next time. Treat the figure as a good estimate, not a headcount.
2. How far do readers get?
This is the most useful chart for most catalogs. It shows the share of reading sessions that reach each page, so you can see exactly where people stop. Flipable also points out the biggest single drop between two pages.
What to do with it:
- A steady, gentle decline is normal. Few people read a 60-page catalog to the end.
- A sudden drop is a signal. Look at the page just before it: a long block of text, a section that does not fit the rest, a page that looks like the end.
- If most readers stop early, move your strongest products earlier, or split a very long catalog into shorter ones by theme.
3. Which pages hold attention?
Average time on each page shows where readers slow down. It is active reading time: it counts only while the page is on screen and the reader is active, and it stops after two minutes without a touch or a scroll. A single visit to a page is also capped at five minutes in the report, so a tab left open over lunch does not distort the average.
Read this together with the previous chart. A page that holds readers for a long time and keeps them reading is working. A page that holds them for a long time and is followed by a drop may be confusing rather than interesting: too dense, too small to read on a phone, or missing the one piece of information people were looking for.
4. Where do readers come from?
Sessions are grouped by where they came from: email, messaging apps, social media, the sites you embedded the catalog on, and direct visits.
Two things to keep in mind. First, the grouping is based on the site that sent the reader, so "direct" collects every visit that arrived without saying where from: typed or pasted links, and many apps and email programs that do not pass that information on. A large "direct" share usually means "shared privately", not "typed in". Second, the embedded-sites channel is a good measure of how much your own website contributes: if it stays near zero, the catalog may be embedded somewhere visitors do not reach.
5. What are readers looking for?
The reading tools people use tell you about the catalog itself.
- Search, and searches that find nothing. Flipable shows what share of searches returned no results. A high figure means readers are looking for something that is not in the catalog, or calling it by a different name. Either way, that is a list of words worth adding, or products worth including. (If your PDF is a scanned document, search cannot work at all; it has no text to search.)
- Zoom. Heavy zooming usually means the type is too small for the screens your readers use.
- How readers jump between pages: thumbnails, the table of contents, search results, swiping or direct links. If nobody uses the table of contents, it may be hard to find, or the catalog may not need one.
6. Do readers act?
Two figures matter here. Returning readers, people with more than one session, show whether the catalog is something people come back to, which is exactly what you want from a reference catalog or a price list. Link clicks, grouped by the site each link leads to, show which destinations readers actually go to.
If you add interactive elements such as videos, galleries or pop-ups, a separate report shows how each one is used, including how many people watched a video to the end. Only time actually played is counted; skipping ahead does not count as watching.
Under Analytics → Interactions, the element map puts this on the page itself: every link or pop-up you added appears as a box on its page, darker where readers used it more and dashed where nobody did. It covers only elements you added in the editor. For the rest of the page, the click map right below it shows where readers tapped or clicked, as warmer areas over the page itself, and counts what was clicked (empty space, text, image, link). Only the position and the type of target are recorded, never the text that was clicked, and positions are deleted after 90 days. Areas with fewer than 5 clicks are not drawn, and with only a few clicks the picture is a first impression, not a trend.
What the numbers cannot tell you
- Who read it. Readers are counted anonymously: no names, no email addresses, no companies. If you need to know who is interested, ask them, with a form or a contact button on your own site.
- Device or country. Flipable does not break readers down this way.
- What happened after the click. Your catalog report ends when a reader leaves for your website. To see whether those visitors signed up or bought something, tag your links so your own website analytics can recognise them. We explain how in How Many Visitors Does Your Catalog Send to Your Website?.
A monthly routine
Once a month, for each catalog that matters:
- Compare views and unique visitors with the previous period, and match the busiest day with what you sent out.
- Find the biggest drop in how far readers get, and look at the page before it.
- Check the share of searches that found nothing, and note the words.
- Look at which link destinations get clicks, and which do not.
- Write down one change for the next issue. Then check whether it made a difference.
That last step is what turns a report into a better catalog. If you are still weighing whether to publish your catalog this way, PDF Catalog vs. Flipbook covers what changes and what does not.
Altri articoli
- How to Make a Digital Magazine Interactive (Without Turning It Into a Website)Links, video, hotspots, pop-ups and galleries: what each one is for, where it belongs on the page, and how to tell afterwards whether readers actually used it.10 novembre 2026 · 6 min di lettura
- How Many Visitors Does Your Catalog Send to Your Website?Your catalog report stops when a reader clicks through to your site, and your website analytics cannot tell which catalog they came from. A plain-language guide to UTM tags, and how Flipable adds them to your links automatically.3 novembre 2026 · 5 min di lettura
Pronto a pubblicare il tuo catalogo interattivo?